As mobile malware advances to the levels of desktop malware, it’s not uncommon to stumble upon protected APKs while analysing malware. Most of the times, the sample is simply obfuscated via classes/variables name stripping from the DEX file and/or strings obfuscation; but other times several layers divide the researcher from the original code, including:
- anti-debug: Aimed at stopping debuggers from being attached to a process or making the application act differently if a debugger is detected. Anti-debugging techniques exist both for the Dalvik and native code (e.g. checking the state of JDWP or ptrace).
- anti-hooking: Aimed at stopping frameworks like Xposed, Cydia substrate or Frida to achieve early instrumentation. The idea is mainly based on checking for side-effects or fingerprints caused by the frameworks (e.g. checking for injected libraries or stack calls to the framework functions).
- anti-emulation: Using the Android emulator, QEMU or Genymotion is always a good way to start investigating a potentially harmful application, see how it executes and if it triggers any strange behavior. Many protected or malicious APKs will refuse to start or work accordingly on an emulated environment (e.g. a malware may not start the infection routine if an emulated or analysis environment is detected).
- encoding/encrypting: Resource files or executable code can be distributed in a compressed or encrypted form. If the protection is made of different execution stubs, each stub executes and decodes the next one before jumping to it. The same may be applied to the resources used by the application.
- breaking static analysis tools: This usually requires a good knowledge of the limitations of the tools used for the analysis. For example, a protection can take advantage of a specially crafted classes.dex or ELF file that is not correctly handled by a tool. The idea can be applied both at the file structure or at the code level; it’s common to see ELF files with stripped sections, malformed headers or anti-decompilation tricks applied to the code 1.
- Obfuscation:
- CFG obfuscation: This step is usually applied to native code and most of the time is the result of applying LLVM-Obfuscator to the code.
- Virtualisation obfuscation: This is a common kind of obfuscation in all the desktop oriented commercial protectors. The main idea is to generate a custom bytecode language that will then be executed by a virtual machine. Part of the article will explain how to deal with the analysis of a virtual machine and which are the common fingerprints to detect virtualization obfuscation.
The best approach to learn how to defeat these techniques is to understand more about their implementation. For example, simply searching Google for “Android anti-debugging techniques” will reveal a huge amount of research on the topic.
Available attack methodologies
Different kinds of analysis and attack methodologies have been developed to address the unpacking problem. The following is a brief list of research projects aimed at automatically extracting the original code from a protected APK, and can be divided in two main groups:
- Modifications to the Android source code: The key idea behind this kind of solution is to modify and recompile the ART and Dalvik runtime libraries (libart.so and libdvm.so respectively) to hook specific functions used to load the classes in memory and execute the bytecode. The data structures loaded in memory are identified, dumped and a classes.dex file similar to the original is reconstructed. Several projects have been developed belonging to this category, to cite a few (in chronological order):
- DexHunter 2: Targets both the Dalvik and ART runtimes and it’s entirely based on the idea of detecting when a new class is loaded and initialised in memory; it then dumps it and the final result will be a reconstructed DEX file.
- AppSpear 3: Targets only the Dalvik runtime and its idea is similar to DexHunter, but instead of hooking into the methods to load the classes, it modifies the libdvm.so code to detect and dump the Dalvik Data Structure, which is a crucial structure used internally by the VM implementation to execute the bytecode.
- Android_unpacker 4: Targets the dex_file.cc source code and injects only the necessary code to dump a DEX file once it’s opened by the execution runtime.
- Helper scripts: Other times we may not be able to recompile the Android source code (or we may not want to do it) and we should rely on an hooking environment like the Xposed framework or Cydia substrate (if available for the device we are using for the analysis) or a more widely-supported approach using a debugger (e.g. GDB/ptrace). The idea is to develop a hooking script to control the application execution and save all the dynamically loaded files. Some of the available scripts based on this solution are:
- DexHook 5: This is a simple Xposed module which hooks the main methods to dynamically load a DEX file; as shown in the previous blogpost, it can be easily extended to implement more elaborated hooks into the ART or Dalvik runtime.
- gdb scripts 6: This is a collection of scripts that employ ptrace and gdb power to debug a process and dump the dynamically loaded DEX file.
Although the listed solutions are perfect for a quick assessment on the nature of the sample to be analyzed, sometimes it’s worth taking a deeper look on how a particular protection works and to acknowledge all the used techniques. We can’t be sure if the dumped code is complete until we fully understood the unpacking mechanism used to load it. As an example: the release of a particular classes.dex file may happen only if a specific condition is met; or again a class may have not been loaded at runtime yet and with the dumping mechanism we missed it. Note that some of the listed research papers also took a further step and proposed possible solutions for the arbitrary dynamic loading problem.
We can agree that these are limitations of taking a fully dynamic approach, and that’s why a static reversing approach should be combined in the analysis of code such as protection code, as it may actually give valuable information on the inner working or on little-known anti-analysis tricks that may also be employed by a malware in the wild.
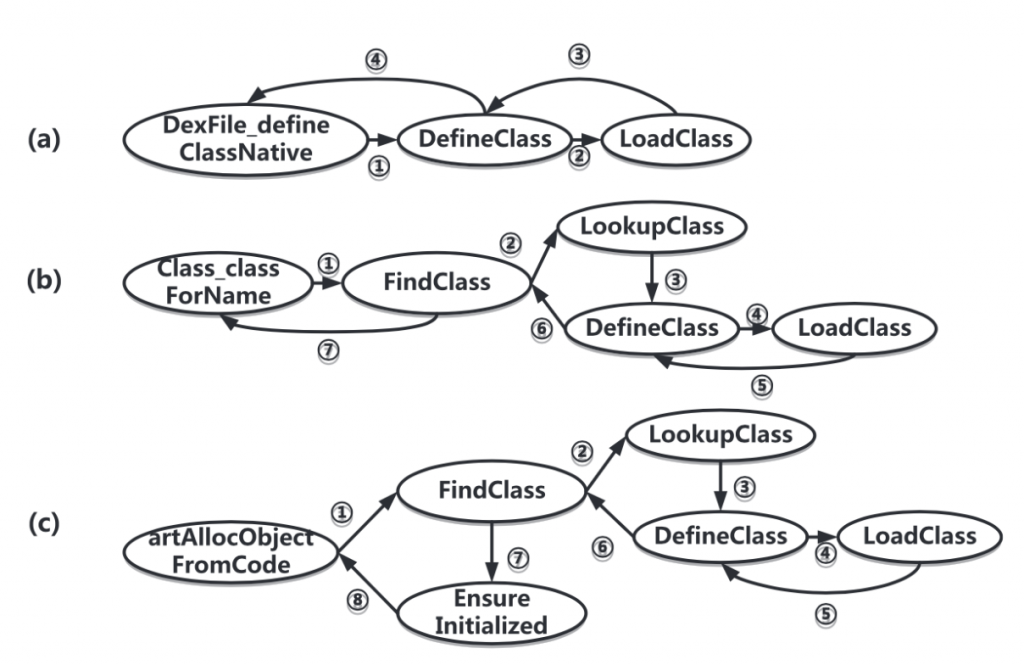 This has been extracted from the DexHunter paper and shows the different ways a class can be loaded in memory at runtime.

 This has been extracted from the AppSpear paper and shows the in-memory structure of the DDS.

Example Case
The sample we are going to explore has been chosen because a lot of Chinese applications are protected with it and several of them turned out to be malicious. The protection has been updated and strengthen during the past months, but the core ideas have been kept mostly unchanged.
This packer does not deliver obfuscation at smali level, but the protection’s stub is made of several layers that, at the end of the execution, will load the original classes.dex file in memory. The following description outlines how this particular protection has been analysed, with some hints that may be useful while reverse engineering similar samples.
Entry point
Inspecting the protected APK with jadx, we can immediately see that the AndroidManifest.xml still contains all the original information in clear (e.g. permissions, activities, services, receivers and providers) and that the original APK resources don’t seem to be compressed or encrypted; other protectors may corrupt or obfuscate the manifest and the resources to thwart the analysis tools, but this is clearly not the case.
Taking a look at the identified package and decompiled classes, we can notice that none of the original entry points declared in the AndroidManifest.xml are available; instead a class named com.qihoo.util.StubApp1868252644 poses as new entry point, or more appropriately it poses as protection’s stub. The class inherits from android.app.Application 7, this is done to guarantee the execution before any other application class when the process is created. According to the documentation, the com.qihoo.util.StubApp1868252644 should have been declared in the manifest application tag, and in fact there can be found.
AndroidManifest.xml entry point Application class.
The decompiled code also includes other two classes:
- com.qihoo.util.Configuration: Used to declare different app configurations; in this case the ENABLE_CRASH_REPORT variable has been set to false, so we can conclude the crash reports have been disabled.
- com.qihoo.util.QHDialog: During the analysis of the native code, we can identify the true meaning of this class that is displaying error messages in a toast dialog in case something goes wrong during the unpacking phase.
We gave a look at the decompiled code through jadx, but we concluded that although the manifest and the resources are there, the original code is clearly missing from the classes.dex file embedded in the APK, but is it really gone?
The classes.dex file size is roughly 4.3 MB, but it contains only 3 classes with not enough code to explain the size. The next step is looking at the DEX header:
 010Editor with the DEX template has been used to analyse the header.

The DEX header shows a data_size of 6104 bytes and a data_off value of 2712. If we go to the offset 8816, we clearly see that we didn’t reach the end of the DEX file as usually expected, so something is incorrect. The first bytes at that offset don’t look really meaningful, but a educated eye may notice that the first 2 bytes form the string “qh” which really looks like a magic value to identify the Qihoo data section start (spoiler: it is).
 First bytes of the Qihoo header section.
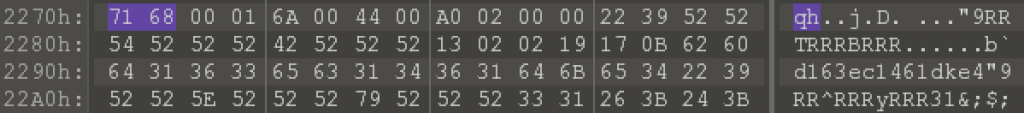
We can’t get many more information from the sequence of bytes; we can guess that it’s somehow encoded (e.g. notice that we see the 0x52 value repeating a lot, some hint to a possible simple XOR encoding?).
It’s time to move to the analysis of the com.qihoo.util.StubApp1868252644 code, the following is the snippet of decompiled source:
StubApp1868252644 decompiled code.
The source code is not obfuscated in any way, and the entry point can be identified with the attachBaseContext 8 method:
- The original context is saved;
- The CPU ABI is detected and the name for the native stub library is generated;
- The correct native library is copied to the files folder (with 775 permissions);
- The native library is finally loaded with a call to System.load().
Transition to the native code
Once the library is loaded, the execution passes to the native code and we need to acknowledge an important thing before proceeding, namely being sure we don’t miss any code during the loading phase of the native library. In fact, the ELF structure and linker documentation details a step taken by the runtime linker before the control is passed to the entry point of the shared library (that is JNI_OnLoad); meet the “Initialization and Termination Routines”. Citing the documentation [9, 10]:
“The .preinit_array, .init_array, and .init sections, are created by the link-editor when a dynamic object is built. These sections are labeled with the .dynamic tags DT_PREINIT_ARRAY, DT_INIT_ARRAY and DT_INIT respectively. The functions whose addresses are contained in the arrays specified by DT_PREINIT_ARRAY and DT_INIT_ARRAY are executed by the runtime linker in the same order in which their addresses appear in the array.”
To check the presence of the initialization sections, we can rely both on 010Editor with help of the ELF template or writing a simple script with LIEF 11 to extract the needed information:
Script based of LIEF to get the Initialization and Termination Rountines.
Executing the script on the native library will reveal the presence of a termination routine at offset 0x1a00 and the absence of any initialization routine. Apparently, newer versions of the protector have two function offsets in the .init_array section and the functions should be used to initialize some strings and clear the dynamic section once the ELF is completely loaded; this is used as a way to scramble the dynamic analysis. At this point, we can safely start our analysis from the conventional entry point function JNI_OnLoad; for the static and dynamic analysis IDA will be our tool of trade.
 libjiagu.so ELF header and Initialisation & Termination Routines.

After loading the APK on an IDA window and the native library on another one, as explained in this blogpost, we can start our dynamic analysis in the native world. The JNI_OnLoad function retrieves the JNIEnv pointer as usual and then jumps to a quite interesting function that I renamed VM_ENTER.
 VM_ENTER function code.

The function is interesting because: if you are familiar with virtual machine obfuscation, you can identify the snippet of code as being the VM_ENTER function executed right before jumping to the virtual machine execution loop. It implements some common operations:
- Allocates a virtual stack (or scratch space) of 0x100 bytes (the 0xC bytes are not included because they don’t seem to be part of the virtual environment);
- Saves the original value of the SP register;
- Saves the original value of the R0 to R12, LR and PC registers;
- Loads the bytecode pointer in R0 and the bytecode size in R1.
It then jumps to another function renamed as EXECUTE_BYTECODE which implements the following operations:
- Saves the original status flags;
- Pushes the 0x1024 value which has been called VM_MARK, because it’s actually used to identify the boundaries of the saved original context;
- Finally, the execution jumps to the real main routine named VIRTUAL_MACHINE, whose purpose is to parse and execute the input bytecode (remember R0 and R1).
 EXECUTE_BYTECODE function code.

The VIRTUAL_MACHINE function execution graph may look a bit scary at first but it’s made of many single blocks that should be approached individually to understand the flow.
 VIRTUAL_MACHINE function execution graph.

Explanation of the virtual machine
The virtual machine body will now be explained and the analysis of two simple virtual instructions will be detailed. All references to ARM registers will apply solely to the analysed sample. The main point about this explanation is giving an insight on how to reverse a virtual machine, but it’s not to be assumed as a general solution to the virtual machine obfuscation problem. In the Attachments section, a simple de-virtualizer script can be downloaded to check how the virtual semantic has been converted to a pseudo-ARM semantic.
The protection implementation of the virtual machine loop follows a pretty common execution sequence, but other solutions, although similar, may follow a completely different approach 12.
The execution loop is made of the following phases:
- Before entering the loop, the stack pointer is rolled back until the VM_MARK is reached, the VM saves a pointer to the rolled address and uses it to access what has been called VM_REG_CTX;
- Three registers are initialized with the following values:
- VM_BYTECODE_SIZE: The register contains the size of the bytecode;
- VM_BYTECODE_PTR: The register contains the pointer to the bytecode;
- VM_BYTECODE_INDEX: The register contains the virtual PC.
- The real loop is executed and can be translated to a higher level code as follows.

Each virtual opcode has a different semantic, updates the VM_REG_CTX and the VM_BYTECODE_INDEX accordingly.
The two VM instructions that we are going to look at have been named VM_NOP and VM_CALL. For the following analysis the execution context is the following:
- R4 = VM_BYTECODE_PTR
- R5 = VM_REG_CTX
- R12 = VM_BYTECODE_INDEX
VM_NOP
This is the simplest of all the instructions and, as the name suggests, it does nothing; in fact NOP stands for No OPeration. The virtual PC is incremented by 1 and saved.
 Native code of the VM_NOP virtual instruction.

VM_CALL
This is an important virtual instruction which is used to call all the functions or APIs from the virtualized code. Hooking the following code will help understand the anti-debug tricks and the unpacking phase before jumping to the second native stub of the protection.
 Native code of the VM_CALL virtual instruction.

Writing the de-virtualizer
To be able to write the de-virtualizer, the following steps have been taken:
- All the bytecode arrays and bytecode sizes have been identified in the shared library;
- The execution has been manually followed and the ARM code has been converted to higher level Python code;
- The semantic of each virtual instruction has been converted to a pseudo-ARM sequence of instructions, using the support of temporary virtual registers if needed;
- Giving the bytecode and its size in input to the Python script will result in a sequence of ARM blocks in output.
The Python code is obviously not production ready, but it’s good enough to be able to analyze the virtualized code in the sample and to be used as a base to build similar de-virtualizers. The real challenge has been understanding how the virtual machine handles the conditional control flow (which is entirely based on the value of the virtual CPSR register) and to implement correctly the semantic of the helper functions used by the virtual machine (e.g. arithmetic, bit-testing and control-flow functions).
The sample in question has four bytecode virtualized sequences; the control flow graph of the first and third functions have been generated as example:
 These are the CFG of the first bytecode sequence (on left) and of the third bytecode sequence (on right).

As can be spotted, there are a lot of BLX calls, and the destination address has been identified. Although the de-virtualized code may not be perfect at first, also at early stages it’s going to give an indication of which operations are carried on and which functions are called.
Newer versions
Another analysis of a newer version of the protector is available 13, but translating from Chinese to English, it’s not clear if the virtualization mechanism has been removed or drastically changed. The analysis makes it clear that during the anti-debugging steps, a lot of jumps have been executed by the code, so it seems the virtualization is still in place, but it was probably ignored during the research phase.
Anti-debug techniques
Like every respectable protector, also this one relies on anti-debug checks in the early stage of the unpacking phase. In particular, the first bytecode sequence embeds all of the BLX calls to the anti-debugger functions and modifies the execution accordingly (e.g. killing the process with raise(SIGKILL)).
A brief list of anti-debug checks present in the sample are:
- Opening proc/self/status and reading the value of TracerPid, assuring it has 0 value.
- Opening the linker /system/bin/linker and reading the first byte of the function rtld_db_activity; if a debugger is not attached, that function is just an empty stub, while, if a debugger is attached, a breakpoint or undefined instruction is placed there. The byte value is again assured be 0.
- Monitoring the /proc/{pid}/cmdline of all the accessible processes to guarantee that some strings are not present (e.g. android_server, gdb, gdbserver and others).
- Checking if /proc/net/tcp contains the 00000000:23946 string; if found it means the default IDA debugger is attached to the device.
- The process memory ( proc/self/mem and proc/self/pagemap) is monitored via inotify to check if new non-permitted mapping occurs in the process space.
After all anti-debug checks have been validated the second stub unpacking stage starts, and the execution can be summed up with the following steps:
- A memory allocation of 0x2F24D bytes takes place and a encrypted and compressed stream of bytes is copied into it.
- The bytes stream is decoded and a new memory allocation of 0x52A88 bytes takes place.
- The destination pointer (0x52A88), the destination size, the source pointer (0x2F24D map) and the source size are prepared and used as arguments for the zlib->uncompress() function.
- The uncompressed stream of bytes is a new ELF file, to all effects the second stub.
Internal ELF loading
The second stub ELF file has been uncompressed in memory, but it has not been properly loaded by the system. In fact, the native library integrates a ripped portion of the system ELF loader & dynamic linker aimed at properly initializing the second stub. The process consists of the following phases 14:
- The libdl.so library is loaded in the process space (if not already present).
- A 0x20 bytes structure is allocated and used internally by Jiagu360 to keep track of some important values (e.g. second stub allocation pointer, ELF header pointer, ELF program header pointer, header size, number of program header entries, load segments size, load segments pointers). IDA helped with its powerful structure support.
- All the PT_LOAD segments are mapped, populated from the file and the correct memory access attributes are properly set.
- The PT_DYNAMIC table is parsed and every dynamic entry is properly handled with a big switch-case based on the d_tag type.
- Then DT_NEEDED entries of each necessary shared objects are checked and if a library is missing it’s dynamically loaded at runtime.
- The last step is to handle the relocations tables; each relocation entry implies a symbol lookup which is carried on with the DT_HASH and DT_GNU_HASH hash tables.
- At this point all the executable code is ready in memory and the last step before jumping to the JNI_OnLoad function of the second stub is to execute the Initialization Routines. From a quick view of the initialization functions code we can easily spot different indicators of the C++ language being used (e.g. each function allocates some memory and initializes it with what looks like a constructor).
- Finally the execution is passed from libjiagu.so to the JNI_OnLoad entry of the newly loaded ELF file.
 Second stub ELF header and Initialisation & Termination Routines.
JNI bridge to the Dalvik world
The second stub contains a lot more code than the loaded native library. In fact, it’s main purpose is to identify the Android execution environment (ART or Dalvik), decrypt and load the original classes.dex (more than one if MultiDex is supported). The loading steps can be summed up as follows:
- The Android execution environment is identified, basing the checks on the presence of the libdvm.so or libart.so libraries. A special treatment is reserved to the YunOS. In fact, the environment type is extracted from the ro.yunos.vm.name system property.
- If the Dalvik runtime is detected, a class of size 0x14 bytes is allocated, whether if the ART runtime is detected a class of size 0x5C bytes is allocated. Each class derives from a common parent class named Runtime, and the proper vtable is loaded.
- The ART loading counterpart is slightly harder to follow than the Dalvik one; the main difference is that on ART the file format of the Dalvik bytecode is more complex and it must be converted to an optimized form before being executed. In the following steps only the Dalvik loading process is explained.
- The original (O)DEX file is searched in proc/self/maps and a check is done to guarantee the file is actually protected (the “qh” tag is used for this, as previously stated it identifies the start of the protection’s header and data section). The start address and size of the (O)DEX map are saved in a structure; additionally a pointer to the header section is saved too.
- At this point the fourth virtualized function is executed (with arguments: R0 = pointer to the protection’s section + 0xC, R1 = 0x2A0 which is the size of the protection’s header) and some important actions take place: a 128-bit decryption key is generated and the 0x2A0 bytes of the protection’s header are decoded with the 0x52 XOR key, as expected, resulting in the following sequence of METADATA:
 The metadata values for activityName, apk-md5, checkSum and pkg have been changed with fake ones.

- The METADATA list contains all kind of information that will be used by the loading functions to rebuild the original code, verify if it has been tampered and enable additional functionalities like the support for x86 code or the crash handler.
- All the METADATA are parsed and inserted in what appears to be a radix-tree 15. The rest of the code will extract values from the tree using the keys.
- The crash report functionalities and the signature check to verify the .appkey take place.
- Now the most important step is executed, being it the decryption of all the classes.dex embedded in the protection’s data section (right after the protection’s header). The data can be decoded using RC4 or SM4 and the 128-bit decryption key is used to initialize the block ciphers. A new section is mapped for each classes.dex, the encoded data are copied into it and then decrypted.
- Every time a new classes.dex is decoded, all the information coming from the DEX header are extracted, the activityName is searched inside the available classes to understand which of the decrypted classes.dex contains the original entry point declared in the AndroidManifest.xml and the mCookie value of each DEX file is used to add the DEX file to the current ClassLoader. These operations are carried on differently based on the ro.build.version.sdk value.
- After all the classes.dex have been correctly released on memory, it’s time to fix the dummy values contained in some fields of the com.qihoo.util.StubApp1868252644 and com.qihoo.util.StartActivity (if present) classes:
- The strEntryApplication field, which contained the dummy value “com.qihoo360.crypt.entryRunApplication” is replaced with the original value associated with the METADATA key appName, which in our case has the value “com.fake.application.MainApplication”.
- The mEntryActivity field in this case was not present because the StartActivity class was not declared; in any case the original value associated with the METADATA key activityName is used in place of the value of mEntryActivity.
- At this point, the loading process is almost complete, the getClassNameList function pointer is overwritten by a native implementation offered by the protection’s library (a different one for ART and Dalvik). Looking at the com.qihoo.util.StubApp1868252644, we can also see a lot of methods (e.g. interface5, interface6) marked as native, meaning that their implementation is offered through native code based on the JNI interface. In fact, before returning to the Dalvik environment those interfaces are registered:
- interface9 of the CrashReportDataFactory class if the crash support is enabled;
- mark, interface5, interface6, interface7, interface8 of the StubApp1868252644 class.
- JNI_OnLoad ends its execution and the control returns to the StubApp1868252644 class where a new instance of the strEntryApplication is created and the internal attach function is invoked to setup the ClassLoader crafted by the native code.
- The interface8 function is called, and is responsible for the initialization of the content provides of the original application. Right after also the native assets are initialized with a call to the initAssetForNative method.
- The onCreate method of the StubApp1868252644 is executed and is responsible for the initialization of the crash report functionalities on Java side. Then interface7 is called and the original strEntryApplication is loaded to be executed. Finally the interface5 is executed and updates the assetPaths adding the path /data/data/<pkg_name>/files/.
- The execution is finally moved to the original Application class, which on the METADATA had the value: com.fake.application.MainApplication.
Tools of trade
During the analysis various tools have been used to get more information about the file structures or the code itself. Here is the recap:
- Dextra 16: It’s a tool shipped with the Android Internals book, particularly useful to analyse all kind of Dalvik and ART files format introduced in Android.
- 010Editor: It’s the de facto tool to analyze known and unknown binary files; its template system is really powerful and the demo version is enough to handle all kinds of analysis.
- LIEF: It has been used to write little scripts to ease the analysis of the ELF files; it can do a lot more than this, so checking the documentation is highly suggested. For example it may turn particularly useful to rebuild a corrupted ELF file (e.g. some protectors do it).
- jadx: It has been used to analyse the decompiled Java code; it’s particularly useful in this case, but being not supported anymore it often fails with newer kinds of protectors. A valuable alternative is to use smali or apktool to get the smali code.
- IDA: It has been used for analysis analysis of the native stubs. The second stub has been written in C++ and IDA enables an almost painless way to handle C++ classes and vtables.
Attachments
This is a list of resources that have been developed during the analysis of the protection; they can be found at the following repository.
- ITR.py: It’s the script used to parse the protection’s library and extract the Initialization and Termination Routines.
- vm_emulator.py: It’s the high level implementation of the virtual machine; it has been used to analyze the virtualized code and generate control flow graphs of the pseudo-ARM output.
Notes
- As an example, the Firehash protection crafted the codeflow in a way that thwarts the automatic functions analysis executed by IDA at the start of a reversing session. During the test of the demo application, IDA took more than 20 minutes to complete the analysis. The idea employed by the protection is to insert a huge amount of opaque predicates in the control flow; IDA will then analyse each conditional jump and build a nice looking graph, but considering a conditional jump is inserted every 2/3 instructions it takes long time to complete.
- https://github.com/zyq8709/DexHunter
- https://link.springer.com/chapter/10.1007/978-3-319-26362-5_17
- https://github.com/CheckPointSW/android_unpacker
- https://github.com/rednaga/DexHook
- https://github.com/strazzere/android-unpacker
- https://developer.android.com/reference/android/app/Application.html
- https://developer.android.com/reference/android/content/ContextWrapper.html#attachBaseContext(android.content.Context)
- https://docs.oracle.com/cd/E19683-01/816-1386/6m7qcobks/index.html
- https://android.googlesource.com/platform/bionic/+/android-4.2_r1/linker/README.TXT
- https://lief.quarkslab.com/
- For example the latest VMProtect solution doesn’t employ a loop based execution strategy, but each handler, that is a basic block of code implementing the semantic of a single virtual instruction, calculates the address of the next handler.
- http://www.sohu.com/a/167000502_354899
- This is a simple but extremely valid reference about the loading of ELF files (both static and dynamic) http://www.gabriel.urdhr.fr/2015/09/28/elf-file-format/
- In case you have any insight about the data structure used to save the METADATA feel free to reach me to discuss about it.
- http://newandroidbook.com/tools/dextra.html